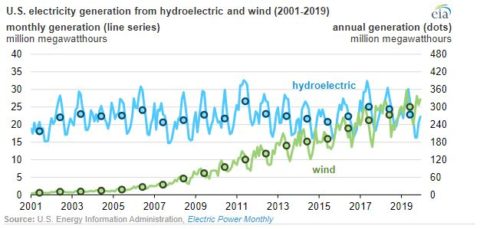
In 2019, annual wind generation in the U.S. exceeded hydroelectric generation for the first time, according to the U.S. Energy Information Administration’s Electric Power Monthly. This means wind is now the top renewable source of electricity generation in the country.Annual wind generation totaled 300 million MWh in 2019, exceeding hydroelectric generation by 26 million MWh. Wind generation has increased steadily during the past decade, in part, EIA says, because the production tax credit (PTC), which drove wind capacity additions, was extended.
Annual hydroelectric generation has fluctuated between 250 million MWh and 320 million MWh in the past decade, reflecting a stable capacity base and variable annual precipitation. Hydroelectric generation is typically greatest in the spring when precipitation and melting snowpack increase water runoff. Although weather patterns also affect wind generation in different regions (with the greatest generation in the spring and fall), capacity growth has been the predominant driver of annual changes in wind generation, EIA reports.
Wind capacity additions tend to come online during the fourth quarter of the year, most likely because of tax benefits. Wind capacity additions totaled 10 GW in 2019 (3.8 GW installed in the fourth quarter), making 2019 the second-largest year for wind capacity additions in the U.S., second only to 2012.Total installed wind capacity surpassed total installed hydroelectric capacity in 2016. And as of the end of 2019, the U.S. had 103 GW of wind capacity, three-fourths of which (77%) was installed in the past decade. The U.S. has 80 GW of hydroelectric capacity, most of which has been operating for several decades. However, only 2 GW of hydroelectric capacity has been added in the past decade, and some of those additions involved converting previously nonpowered dams.
Another important point is that the average annual capacity factors for the hydroelectric fleet between 2009 and 2019 ranged from 35% to 43%. The average annual capacity factors for the U.S. wind fleet were 28% to 35%. Capacity factors are the ratio of the electrical energy produced by a generating unit for a specified period of time to the electrical energy that could have been produced at continuous full power operation during the same period.
renewableenergyworld.com