
$6000000
30t-200tpd plant solid waste to electricity msw power plant

30t-200tpd plant solid waste to electricity msw power plant
I.Garbage Pyrolysis Gasification Technology Principle

II.Principle of Pyrolysis and Gasification
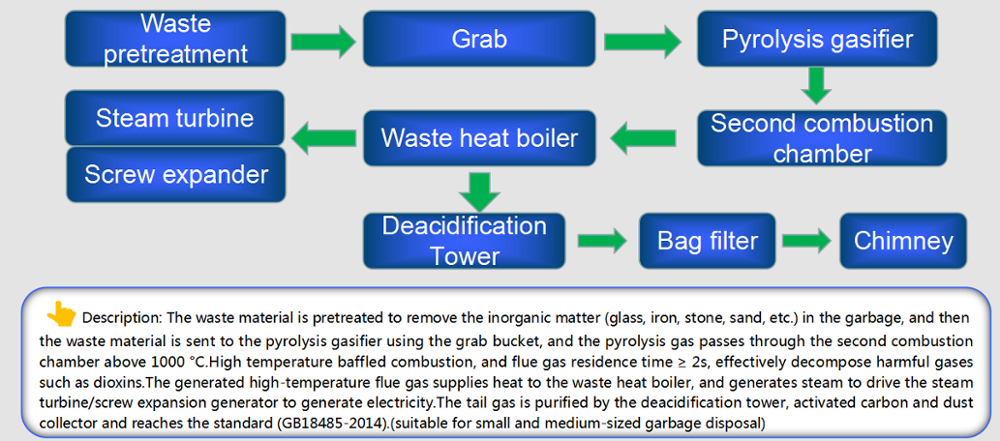
In the process of pyrolysis, water vapor, free oxygen or combined oxygen reacts with carbon in the fuel to form a combustible gas. The process of waste pyrolysis gasification is complicated, and the conditions of pyrolysis gasification reaction are also different, but all the processes of pyrolysis gasification reaction basically include the processes of drying, pyrolysis, oxidation and reduction of biomass.

III.Pyrolysis gasifier body structure

IV.Pyrolysis Gasification Technology Advantages

v.Pyrolysis Gasifier Technical Parameters
No. |
Description |
Unit |
Rated Value |
1 |
The temperature of the primary combustion chamber |
°C |
950~1050 |
2 |
The outlet temperature of flue gas in the primary combustion chamber |
°C |
600~950 |
3 |
The temperature of the secondary combustion chamber |
°C |
950~1100 |
4 |
The time of flue gas stays in the secondary chamber |
s |
>=2 |
5 |
The outlet temperature of the flue gas in the secondary combustion chamber |
°C |
>=850 |
6 |
Outer wall temperature |
°C |
<=50 |
7 |
Noise |
d B(A) |
<=85 |
8 |
Reduction ratio |
% |
>=86 |
9 |
Burning rate |
% |
<=3 |
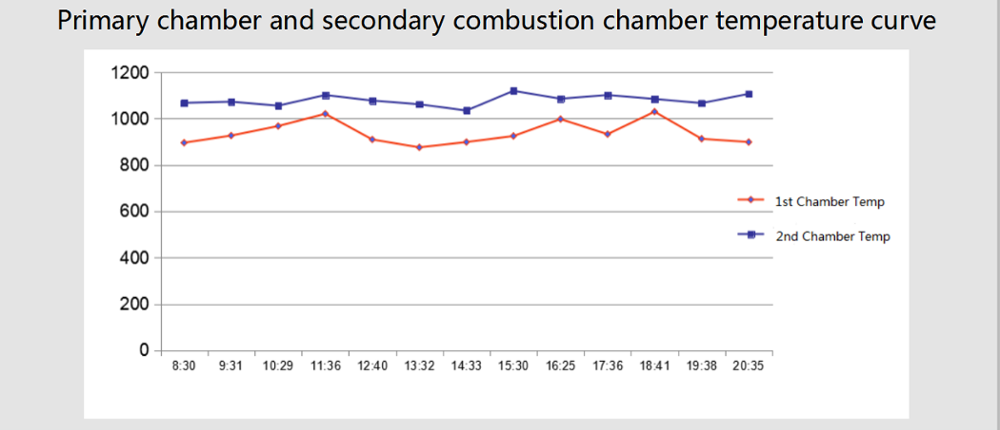
VI.Pyrolysis gasifier technical parameters
Actual measurement data of flue gas components at the exit of primary combustion chamber
Sample |
Primay combustion chamber output temperature |
CO concentration ppm |
Nox concentration mg/m³ |
SO2 concentration mg/m³ |
HCL concentration mg/m³ |
O2 concentration % |
1 |
624 |
48810 |
9.25 |
6.86 |
118.76 |
2.6 |
2 |
595 |
51900 |
0.21 |
3.05 |
131 |
3.1 |
3 |
787 |
39860 |
17.53 |
2.59 |
65.63 |
0.9 |
4 |
464 |
62790 |
19.01 |
4.79 |
55.11 |
2.3 |
5 |
842 |
44900 |
6.97 |
2.52 |
98 |
not detected |
6 |
855 |
57900 |
9.86 |
27.35 |
101.91 |
1.8 |
Average |
694.5 |
51027 |
10.47 |
7.86 |
95.07 |
1.78 |
Slag burning rate reduction
Sample time |
2017.10.1 |
2017.10.15 |
2017.10.30 |
2017.11.14 |
2017.11.29 |
2017.12.14 |
2017.12.19 |
Result |
1.5% |
3.6% |
2.1% |
2.4% |
4.3% |
1.3% |
4.9% |
Average |
2.9% |
||||||
Slag leaching toxicity test data
Item |
Leaching toxicity (mg/l) |
Test limit (mg/l) |
Max. leaching toxicity (mg/l) |
Cyanide |
0.18 |
0.004 |
1.0 |
Fluoride |
0.28 |
0.05 |
50 |
Hg |
0.003 |
0.0005 |
0.05 |
Pb |
N.D |
0.001 |
3 |
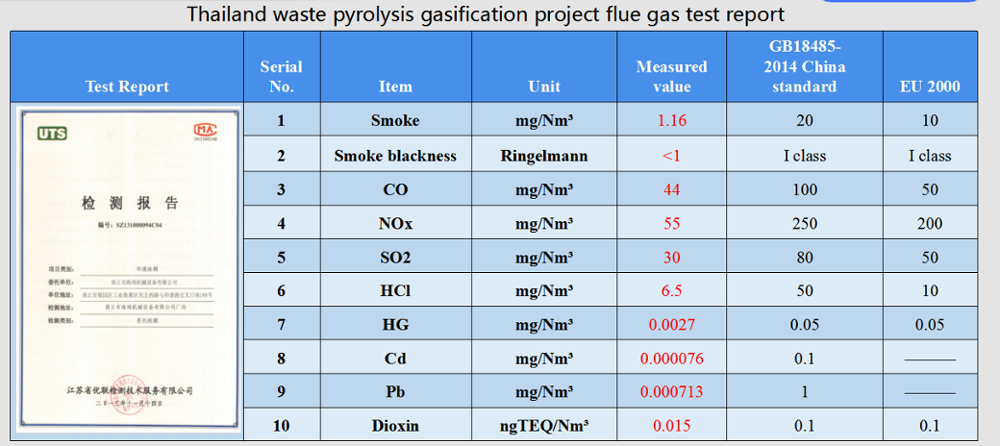
VII.Smoke emission test results
VIII.Waste pyrolysis gasification cogeneration system diagram

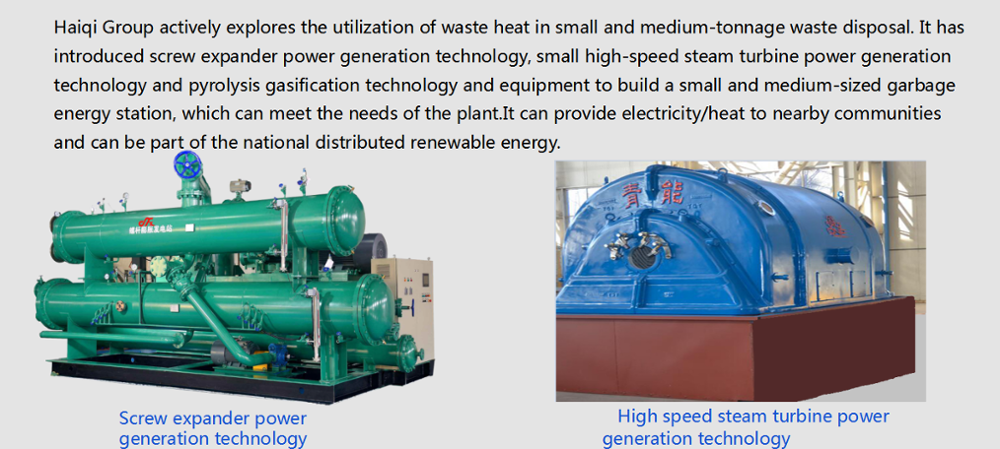
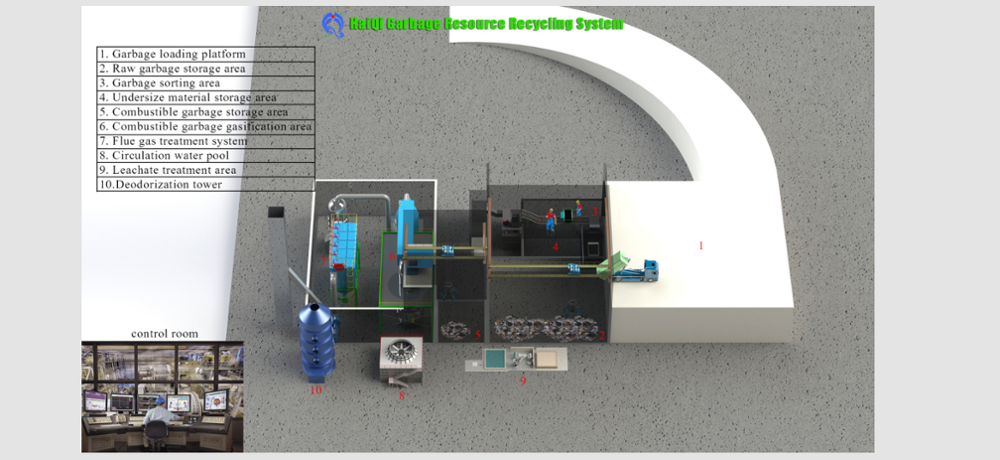
IX.Small and medium-sized garbage energy station
XI.Waste pyrolysis gasification cogeneration system diagram
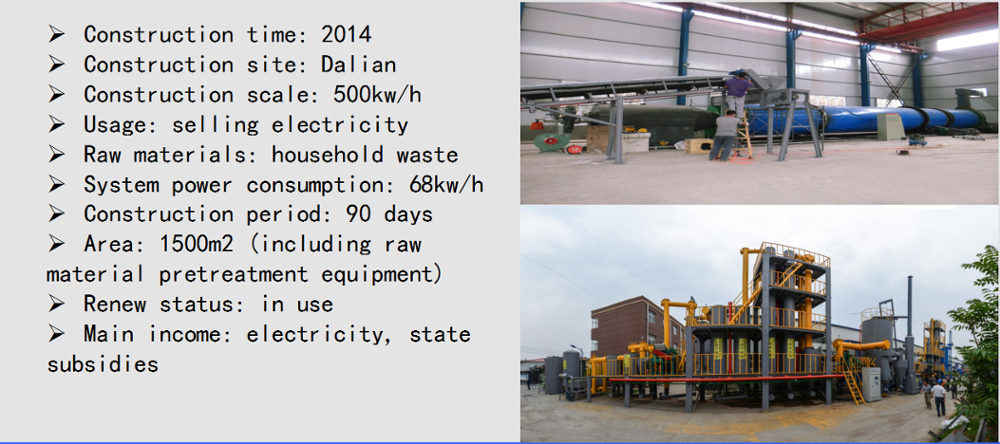
XII.Typical case

XII.Gasifier with boiler & steam turbine parameters
Waste Treatment Capacity After Sorted (Ton/day) |
Gasifier heating supply (Kcal/h) |
Gasifier Inside Diameter (m) |
Waste Consumption (kg/h) |
Matched Waste Heat Boiler (T) |
Power Generation (KW) |
20T |
2,500,000 |
Ø2.0 |
833 |
4 |
Not recommended for power generation |
30T |
3,750,000 |
Ø2.6 |
1250 |
6 |
|
50T |
6,250,000 |
Ø3.3 |
2083 |
10 |
1500kw |
100T |
12,500,000 |
Ø3.3*2 |
4167 |
20 |
3000kw |
200T |
25,000,000 |
Ø3.3*4 |
8333 |
20*2 |
6000kw |
XIII.Processing system diagram
XV.Complete Project Typical Case


Due to the difference in the purchase situation and question time of each consultant, the following responses are only valid for the questioner within 3 days, other netizens are for reference only ~
I want to consult